Table of Contents
The Dashboard gives you a quick look at content activity within your reporting period. It reflects the same data that appears in your snapshot report.
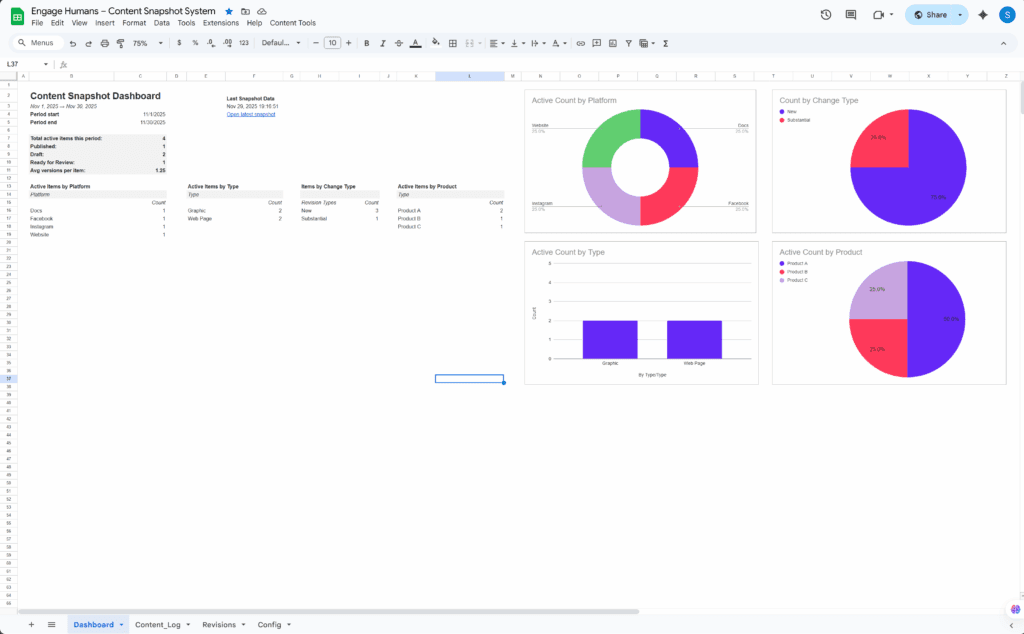
What You’ll See #
The dashboard displays counts and grouped totals for:
- Total active items in the reporting window
- Items by Type
- Items by Platform
- Items by Product (if used)
- Counts by ChangeType (Cosmetic, Substantial, Technical, Archived)
- Active Draft vs. Active Published
- Version and activity summaries
- Current period dates (mirrored from the Config tab)
All dashboard metrics use:
- Active = TRUE
- The date column defined in PeriodDateKey
- PeriodStart and PeriodEnd from the Config tab
What Not to Edit #
Avoid editing:
- C4 and C5 (mirrors of Config dates)
- AA-column reference keys
- Named ranges used by the dashboard
Changing these will break formulas, filters, or charts.
When to Refresh #
If your sheet grows or shrinks significantly, or if charts stop matching the data range, run:
Content Tools → Admin → Refresh Dashboard Range
This adjusts the underlying named range so your charts and tiles always reference the correct rows.


